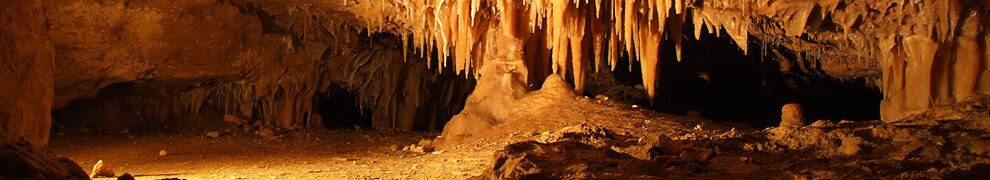
What’s Out West (And Now A Little Bit South) #2

study area

New project study area (source: Google Maps)

Since my last post the wheels have started turning and my directed study has started to gather some momentum. My aim for this project is now not only to create a publicly accessible database on coastal Indigenous sites in South Australia, and produce a subsequent map, but to then use the data collected as a predictive model to analyse where sites can be found and why they might appear there. Another aim is to establish where there are gaps in this sort of knowledge in South Australia, and determine where more extensive work could be carried out in the future.

After a few more meetings with Mick Morrison to discuss necessary information on sites for the database, and countless hours spent in the State Library fossicking through survey reports and sometimes quite old pamphlets, my database appears to be complete. In total, I came across 327 documented sites from Kangaroo Island (now included in the study area), the Adelaide Plains, Yorke and Eyre Peninsula’s, the West Coast and the Nullarbor Plain. The fields of data chosen to include in the database were based on Ulm and Reid’s (2000) ‘Index of Dates from Archaeological Sites in Queensland’, which basically did what I am currently doing, but for the whole of Queensland. This survey is where the idea behind my current research project has come from.

database

Excerpt from database

Another key component of this project is the map, which is created from the data collected. The idea here is to create a basic map in ArcGIS with the site locations included and overly this on a basic map of South Australia with several environmental, hydrological and geological layers to help in my eventual analysis of why sites are where. One of the problems I have run into with the map at the moment is the fact that only very few of the 327 sites, have provided locational data that can be transferred accurately to a GIS. Some of the grid references that were provided on certain sites do not fit accurately with a GIS as can be seen in the map I have begun creating below:

badpoints

The yellow points represent sites that should be on the Nullarbor Plain

There have been some success stories, particularly with the Yorke Peninsula sites and locational data. One survey report on the area contained a map of the region with previous archaeological surveys drawn in. After mapping the sites mentioned in the survey, the resulting map correlated very well with areas that had been surveyed previously, proving that the co-ordinates collected at the time were very accurate.

yp1

Previous survey studies (source: Wood & Westell 1998)

yp2

Mapped sites

By my next post I intend to have my database published to a professional standard and can start critically analysing the data present. I am also aiming to have my map completed with all 327 sites included, which will assist in the analysis of the archaeology of Indigenous coastal sites in South Australia.

Metal you a story

Image

As a part of my directed study, for the past few weeks I have been visiting the museum storage down at Hindmarsh. There, I have been looking at individual pieces of metal that have been collected from the site of the Lady Alice Mine by Keryn Walshe and a few helpers.  The site was sectioned into 4 areas labeled A, B, C and D. From each of these sections they collected large amounts of ceramic, glass and metal.

It was decided that if we wanted to make a connection with the mining side of the Lady Alice Mine then we had to look at the metal more closely and determine which pieces are linked to people’s home life and more importantly which pieces are linked to the mine.

 Over the last few weeks I have looked at each section carefully and have tried to determine what these pieces of metal I had at my disposal were. Where there are easily identifiable pieces, there are always mind-boggling pieces right beside them.  Below is one certain piece that has stopped me, Cameron Hartnell and John Hodges in our tracks. It is a large piece of intertwined metal that looks like a modern day bed spring. 

Image

There are a few pieces of wired metal that have been wound together to increase strength and stability.  As I am not very familiar with metal and/or mining tools I am unsure whether this is some sort of industrial artefact. I guess that means a lot more research. 

There is a significant amount of  metal artefacts that I  have been able to connect back to the mining industry. With more research into the site and  a close look at each distinctive artefact I hope to make a few more connections to the lives of those who once worked and lived at the Lady Alice Mine. 

Blog Post 4 – Last Post – Waltowa Wetland Geophysical Study

This study though not 100% successful in my opinion, has changed my thoughts in regard to hearth detection methodology. The aim of the study was to detect hearths using two different types of geophysical instrument, one being GPR and the other gradiometer. I theorised that by surveying areas known to contain hearths with two types of instrument would double the chances of success. I also theorised that using the gradiometer first to collect data over the 7 grids would be the most time efficient and successful way to detect potential hearths. After viewing the magnetic data and taking note of where potential hearths appeared in the data, the 7 grids were then surveyed using GPR to confirm the anomalies found in the magnetic data set. Unfortunately, though, there were no hearths detected in the first 7 grids surveyed with the gradiometer, this may have been because there are no hearths in any of the grids (unlikely), the line spacings in the grids were too large, or because none of the survey lines were on the alignment of any subsurface hearths.
When the 7 GPR grids were analysed the three grids at blowout A did appear to contain hearth-like anomalies, some shallow (0.4m) (figure 1) and some deeper (1m) (figure 2). These anomalies were marked on site with wooden pegs after being detected with GPR and readings were taken directly over them using the gradiometer. Readings of -7 to +7 nT were experienced over the anomalies, which corresponds to hearths detected in other studies I researched for the literature review section of this directed study. Therefore, if I was to do this study again in this type of environment I would use GPR first to look for hearth-like anomalies, mark them and then conduct magnetic surveys afterwards, confirming or discounting the anomalies detected in the GPR survey. This study has proven that the use of two geophysical instruments can complement each other, increasing the chances of success. Much more testing is required in different environments in order to develop a strong methodology for the detection of submerged hearths, however. This study has inspired me to develop some test areas (potentially in conjunction with my industry partner) with subsurface artificial archaeological anomalies (i.e. hearths, footings, graves etc) for myself and other students for practice, testing, and calibration of geophysical instruments.
I would like to say a big thank you to: Kelly Wiltshire, Heather Burke, and the NRA for all the information and help they have provided me with, throughout the duration of this study.

Figure 1 (left): is a GPR profile from grid 5, blowout A, a hearth-like anomaly can be seen at approximately 0.4m deep at the 2.4m mark in the profile. Depth is expressed in metres on the left-hand side of the scan and distance is expressed in metres on the top of the scan.

Figure 1 (left): is a GPR profile from grid 5, blowout A, a hearth-like anomaly can be seen at approximately 0.4m deep at the 2.4m mark in the profile. Depth is expressed in metres on the left-hand side of the scan and distance is expressed in metres on the top of the scan.

 Figure 2 (right): is also a GPR profile from grid 6, blowout A, a hearth-like anomaly can be seen at 1m depth and 6 metres into the scan. Radar worked well in this environment, with the signal propagating to over two metres.

Figure 2 (right): is also a GPR profile from grid 6, blowout A, a hearth-like anomaly can be seen at 1m depth and 6 metres into the scan. Radar worked well in this environment, with the signal propagating to over two metres.

A glimpse inside the Angas family home: Collingrove Homestead

For my Directed Studies project I am working with the National Trust of South Australia to complete an interpretive study of Collingrove Homestead, located approximately 7km southeast of Angaston. I recently travelled to Collingrove Homestead with Sue Scheiffers, the Vice President of the National Trust of South Australia Council. My aim for this trip was to familiarise myself with the property and the artefacts, and to identify the themes displayed in the collection.

Collingrove Homestead was built by pastoralist John Howard Angas, who arrived in South Australia in 1843. Built in 1856, what started as a modest 3 bedroom cottage flourished into an elaborate homestead over a 60-70 year period. The property is gorgeous, covering an area of approximately 8 hectares. The homestead is a blend of traditional Victorian architecture and modern Edwardian architecture and styling. The homestead and its collection are a reflection of five generations of Angas family members that resided at Collingrove.

Potential themes identified from the collection include:

Family: Family photos are placed throughout the house, depicting five generations of the Angas family. There are also two extremely detailed family tree charts, the family crest and the family bible on display. There’s an overwhelming sense of family pride and respect throughout the homestead.

Pastoralism: Raising livestock was an important aspect of the Angas dynasty. Photos and paintings of the livestock bred and sold are found throughout the house, as well as many documents detailing the breeds, wool etc.

Travel: Exotic artefacts are found in the main hallway and include: stuffed tiger and deer heads, antelope skulls, a leopard pelt, African weapons and bullet shells just to name a few. These exotic keepsakes illustrate a sense of adventure and a passion for travel.

The property really was a delight to visit. I instantly fell in love with the collection. Next time you’re in the Barossa Valley be sure to visit Collingrove Homestead, you will be amazed!

John Howard Angas

John Howard Angas

Family photo
Family photo

  1. Tiger ornament
Tiger ornament


An analysis of the stone artefacts from Gledswood Shelter 1

My directed study project is a part of a larger project that Lynley Wallis is conducting in conjunction with the Woolgar Valley Aboriginal Corporation at the Gledswood Shelter 1 in Northwest Queensland. A number of excavations were  carried out at this shelter in 2006 and 2008. The material from the excavation square, identified as square B0, is the basis for my research project. Excavation of square B0 went down to a depth of 100cm before being blocked by a slab of rock that had fallen from the roof of the shelter. Radiocarbon dating carried out at the site indicates that the material from this square starts at about 10,000 years ago at the deepest point and proceeds to the recent past. The excavation proceeded in twenty 5cm spits, with the material from each spit being sieved and bagged. The next stage of the project for this square is where I get involved.

The artefact material now needs to be cleaned, sorted into material types, weighed, measured and photographed and data needs to be recorded onto a spread sheet.

There needs to be a detailed analysis of the artefacts.  This includes a review of literature of lithic assemblages from the Holocene from other sites relevant to the study site. It also includes the production of a detailed report on the results of the study.

My directed study project is still in its early stages, with the current activity centred on the review of literature relevant to the area. I have just picked up my box of artefacts from the shelter, so now the exciting part starts. I have had a quick look through some of the artefacts from several of the spits and can already notice some significant changes with obvious differences in the presence of some artefacts.

My next update will be during the initial phase of sorting and categorising and I will provide some details on what I am finding.

It’s an ace!

As part of my Directed Study in archaeology I have been researching information about the toys that were found under the floor boards in the Oatlands Gaol, Tasmania.

So far I have had little success in gaining information about the toys, but this week I have had some success. In my collection I have an ace of spades printed by the United States Playing Card Co. It is a Bicycle playing card, number 808. The ace of spades depicts the statue of freedom, which in 1865 was placed on top of the Capitol Building in Washington DC.

The 808 series of playing cards was printed in three colours—red, green and blue—and was introduced in 1885. The ace of spades in my collection is a racer number 1 series, which was introduced in 1895 and ran until 1906.

As mentioned in my earlier post, I am trying to match the date of the toys to families who lived in the  Gaolers’ Residence. From 1895 to 1906 there were six families living in the gaol, and the date range of the card spans the majority of this occupation. Three of the families had children, however playing cards were used more by adults than by children.

I have contacted the Tasmanian Museum and Art Gallery and am hoping that they will be able to provide me with more information about the other toys in my collection. ImageImage

Blog Post 3 – Gradiometer Fire Rock Experiment – Waltowa Wetland Geophysical Study

Before the commencement of the gradiometer surveys testing was conducted over known fire rocks in order to establish the intensity of readings that may be experienced. Testing was conducted at blowout A, as there is an abundance of limestone fire rock lying on the surface of the dunes. These fire rocks may well have been in-situ hearths but have since been uncovered as the dune has eroded away. When I conducted the test it became apparent that not all of the fire rocks gave a strong magnetic reading when traversed with the gradiometer. By accident a theory has arisen as to why this is the case. When testing, a particular fire rock (figure 2) was traversed and gave a high magnetic reading of -24 nT (figure 1). It was picked up off the ground and analysed and set back down in the same position, though by accident it was turned over before being set down again —meaning that the opposite side was then facing upwards. When traversed again the readings were very low (1nT), so my theory is that the face of the rock providing the high readings was the side of the rock that experienced the fire event—hence containing the remnant magnetisation—whilst the other side did not. This seemed to be the case for many of the other rocks tested in this way. There needs to be much more study done in this area, but further testing was beyond the scope of this paper, though this did bring about questions regarding the survey. If the hearths were no longer in-situ and individual stones were shuffled around due to an ever moving dune system, would they be able to be detected by magnetic methods if the fired surface of each rock was not facing upwards? The small amount of testing done during this study would indicate that they would not.

Figure 1: Field Testing - A Bartinton Grad601 sensor sitting on top of a fire rock, providing a reading of -24 nT.

Figure 1: Field Testing – A Bartinton Grad601 sensor sitting on top of a fire rock, providing a reading of -24 nT.

Figure 2: The limestone fire rock that was tested.

Figure 2: The limestone fire rock that was tested.